Peter Lynch Was Right: How to Read a Balance Sheet — and Why Alphabet's Is Exceptional
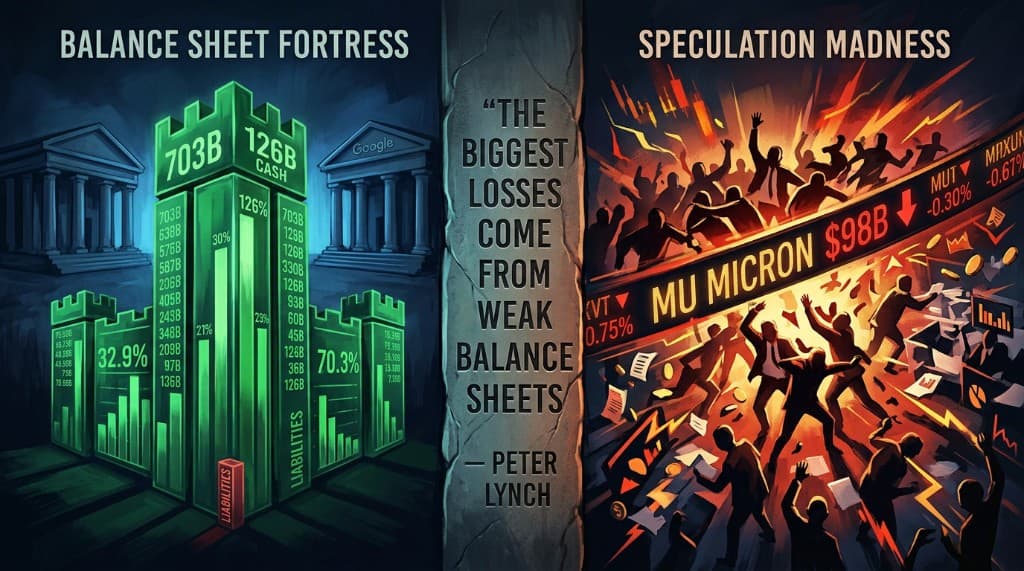
Fernando Sánchez uses Alphabet's real Q1 2026 balance sheet to teach Peter Lynch's core principle: the biggest losses in the stock market come from companies with weak balance sheets. Alphabet's numbers — $49B net cash, zero short-term debt, 1.92x current ratio — tell a very different story. Meanwhile, Micron's $98B single-day trading volume signals speculative frenzy in exactly the wrong sector.
Peter Lynch's most quoted rule about individual stock selection is often reduced to a sound bite about investing in what you know. The more important principle — the one that separates the investors who build wealth from the ones who destroy it — is the one Fernando Sánchez highlighted this week: "Never invest in a company without understanding its finances. The biggest losses in the stock market come from companies with weak balance sheets."
Understanding what a balance sheet actually says is not difficult. It requires knowing three numbers, what they mean, and what questions to ask about them.
The Three Components of Every Balance Sheet
A balance sheet is a snapshot of a company's financial position at a specific moment in time. It always balances because it reflects a simple identity: what a company has equals what it owes plus what belongs to its owners.
Assets are everything the company controls that has economic value: cash, receivables, equipment, intellectual property, investments. They are split into current assets (convertible to cash within twelve months) and non-current assets (longer-term holdings).
Liabilities are what the company owes to others: suppliers, employees, bondholders, tax authorities. Like assets, they divide into current liabilities (due within twelve months) and long-term obligations.
Stockholders' equity — also called book value or net worth — is the residual: assets minus liabilities. It represents what would theoretically remain for shareholders if the company liquidated today, paid every debt, and distributed the remainder. It is not the same as market capitalization, which reflects what investors are willing to pay today for a share of the company's future earnings.
Alphabet's Balance Sheet: The Numbers That Matter
Alphabet's consolidated balance sheet as of March 31, 2026 provides a real-world illustration of what financial strength looks like in one of the world's largest companies.
Total assets: $703.9 billion. The largest components are property and equipment at $281 billion — the physical infrastructure of data centers, servers, and facilities that power Google Search, YouTube, and Google Cloud — and non-marketable securities at $107 billion, which include strategic investments in private companies. Cash and marketable securities together stand at $126.8 billion.
Total liabilities: $225.2 billion. Current liabilities of $111.2 billion include accounts payable, accrued expenses, and deferred revenue — all normal operational obligations. Critically, short-term debt is zero. Alphabet carries no debt maturing within the next twelve months. Long-term debt stands at $77.5 billion.
Total stockholders' equity: $478.7 billion.
The four questions Peter Lynch would ask of any balance sheet, applied to Alphabet:
Does the company have more cash or more debt? Cash and marketable securities of $126.8 billion against long-term debt of $77.5 billion produces a net cash position of approximately $49 billion. Alphabet has more liquid assets than it has debt. It is, at its scale, a net cash business.
Is there more short-term or long-term debt? With zero short-term debt and $77.5 billion in long-term obligations, the debt profile is entirely manageable — the obligations are spread over years, not pressing on the next twelve months.
How has debt evolved? Long-term debt is stable and modest relative to the asset base. There is no sign of debt accumulation that would suggest financial stress.
Are current assets greater than current liabilities? Current assets of $213.8 billion against current liabilities of $111.2 billion gives a current ratio of 1.92. For every dollar Alphabet owes in the next twelve months, it holds nearly two dollars in liquid assets. This is a fortress balance sheet.
What the Market Pays For Beyond the Balance Sheet
Alphabet currently trades at approximately 8.5 times its book value. This premium — the gap between market capitalization and the $478.7 billion stated on the balance sheet — reflects what financial statements cannot capture: the present value of future earnings power.
Investors pay above book value for Alphabet because of the dominance of Google Search (used by 3 billion people), the monetization potential of YouTube, the growth trajectory of Google Cloud (which hit $20 billion quarterly revenue in Q1 2026 at 63% growth), the early-stage monetization of Gemini and AI-native products, and Waymo's autonomous vehicle revenue.
At 8.5x book, the market is pricing in substantial future value creation. Whether that premium is justified depends on whether those future earnings materialize at the rate implied by the current price. If they do — and the evidence from the most recent earnings cycle is that they are exceeding expectations — the current multiple is reasonable. If the stock corrects to the 276-301 range that technical analysis identifies as the next significant support zone, the book value multiple would compress to approximately 6.8-7.5x — historically inexpensive for a company with these balance sheet characteristics and this growth profile.
The Counterexample: Micron's $98 Billion Day
The same week Fernando published this balance sheet analysis, a single data point about the US equity market illustrated the other side of Lynch's principle with perfect timing.
Micron Technology became the most-traded stock in the entire American market during June 2026, surpassing NVIDIA and Tesla by volume. On one Friday alone, buyers and sellers exchanged approximately $98 billion worth of Micron shares — nearly the equivalent of Micron's entire annual revenue, changing hands in a single session.
This is not a sign of sophisticated fundamental investing. It is a sign of speculative frenzy. When the most-traded stock in the world's largest equity market is a memory chip manufacturer — a business that Fernando has explicitly categorized as cyclical, with earnings that can collapse rapidly when demand normalizes — the pattern Lynch warned about is playing out in real time.
Investors who chase Micron at peak volume are not buying a business they understand. They are chasing momentum in a sector where the understanding of cyclicality would lead to entirely different behavior. Lynch's "biggest losses come from companies with weak balance sheets" applies — and so does the corollary: the biggest gains come from understanding the difference between a company with Alphabet's financial fortress and a cyclical business at the peak of its earnings cycle.
The Practical Application
Reading a balance sheet does not require an accounting degree. It requires asking four questions consistently about every company before investing capital.
Does it have more cash than debt? Is the debt profile weighted toward the long term? Has leverage been increasing or decreasing? Can current assets cover current liabilities?
A company that scores well on all four — like Alphabet — is a business where financial failure is unlikely to be the cause of a permanent loss. A company that scores poorly — high short-term debt, current liabilities exceeding current assets, leverage increasing — is exactly the kind of situation Lynch was warning about.
The investors who suffer the most severe losses in equity markets are not the ones who misjudged the growth rate of a good business. They are the ones who owned the wrong business at the wrong moment in its financial cycle, without understanding the balance sheet that would have told them it was fragile.
Analysis based on Fernando Sánchez's channel content from June 2026, incorporating Alphabet Inc.'s unaudited Q1 2026 balance sheet data. This post is for informational and educational purposes only and does not constitute investment advice.
Explore the data
Check the latest congressional trades and active investment signals.