The 5% Annual Tax You Never Voted For: M2, China's Gold Rush, and Why Cash Is the Riskiest Asset
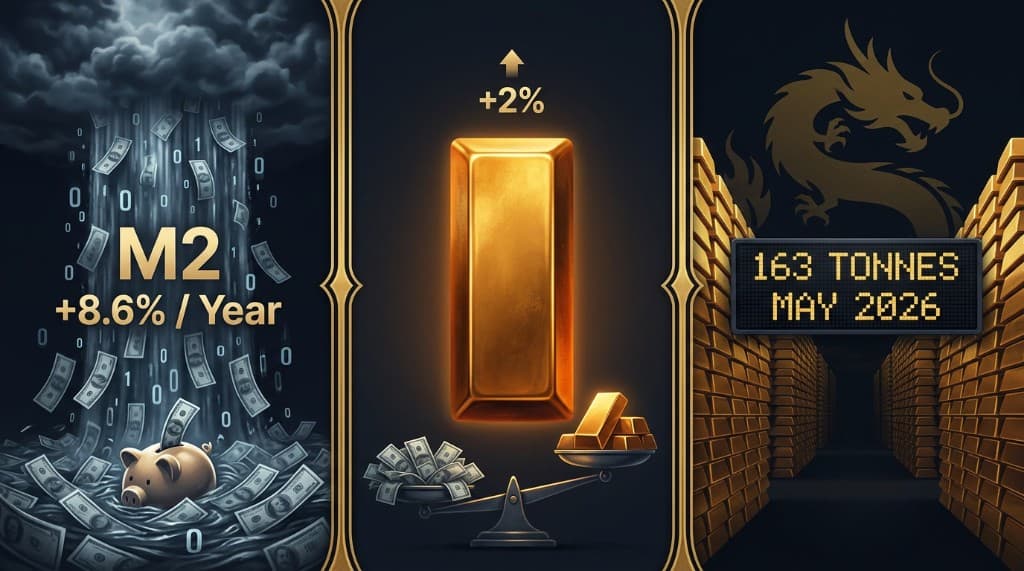
José Luis Cava breaks down the mathematics of monetary degradation: when central banks expand the money supply at 5-9% annually while gold production grows only 2%, holding cash guarantees a real loss. China is already acting on this — importing 163 tonnes of gold in May alone, equivalent to the Fed's entire monthly liquidity injection. The most dangerous investment of our era is the one everybody thinks is safe.
There is a tax that governments never legislate, central banks never announce, and financial media rarely explain in plain terms. It operates silently, every year, on the savings of every citizen who keeps money in a bank account. Its rate is roughly equivalent to the pace at which the money supply grows faster than real economic output. In the United States, that rate is currently around 5% annually. In China, it is 8.6%.
This is not inflation in the conventional sense. It is monetary dilution — the gradual erosion of each unit of currency's purchasing power as more units are created. And understanding its mechanics changes fundamentally how an investor should think about risk.
What M2 Actually Measures
M2 is the broadest commonly used measure of money in circulation. It encompasses physical cash, bank deposits of all maturities, and highly liquid short-term financial instruments like money market funds. The total M2 in the United States currently stands at approximately $32 trillion, of which around 70% represents household savings.
The critical question is not how large M2 is, but how fast it is growing relative to the real economy. When money supply growth outpaces real GDP growth, each existing unit of currency represents a smaller claim on actual goods and services. The purchasing power of savings held in cash decays at approximately the difference between money supply growth and productivity growth.
In China, the relationship becomes even more extreme. The M2-to-GDP ratio in China has reached 250% — the money supply is two and a half times the size of the annual economy. Money supply growth is running at 8.6% per year. For a Chinese citizen holding savings in a bank deposit, roughly 8% of purchasing power evaporates annually in real terms. The mathematically "safest" behavior — keeping money in the bank — is, paradoxically, the guaranteed path to losing real wealth.
In the United States, the number is lower but the mechanism is identical. At 5% annual M2 growth against roughly 2-2.5% real productivity growth, the purchasing power of uninvested dollar savings erodes by approximately 2.5-3% per year. Not through dramatic crashes or obvious crises — through the silent, compounding math of dilution.
Gold's Structural Advantage: The Production Constraint
The reason gold has functioned as a store of value for thousands of years is not tradition or sentiment. It is a physical constraint: gold cannot be created from nothing.
Global gold production grows at approximately 2% annually, and that rate is trending downward as easily accessible deposits are exhausted. This creates a fundamental arithmetic: when money supply grows at 5-9% and gold supply grows at 2%, the gap between the two represents the minimum rate at which gold should appreciate in real terms over the medium and long term.
The math is simple. If money is growing at 9% and gold at 2%, gold must appreciate at approximately 5-6% annually simply to maintain its current exchange ratio with fiat currency — before any additional demand factors. In an environment where institutional demand from central banks and sovereign wealth funds is accelerating, the actual appreciation potential is higher.
Bitcoin shares the structural logic of gold's production constraint through its mathematically fixed supply schedule. Where gold's scarcity is enforced by geology, Bitcoin's is enforced by code. The long-term directional trajectory — appreciation against fiat currencies that expand without limit — is the same.
China's Gold Import Data: The Numbers That Matter
The most significant gold market development of 2026 is not a price chart or a technical pattern. It is a quantity.
In May 2026, China imported 163 tonnes of gold. At current prices, that is approximately $21 billion — in a single month. Across the preceding three months, monthly imports have consistently exceeded 150 tonnes. This is not diversification at the margin. This is systematic, high-volume accumulation.
For context: $21 billion is roughly equivalent to the Federal Reserve's entire monthly net liquidity injection into the US financial system. China is effectively absorbing — in gold — the same volume of purchasing power that the Fed creates in dollars every month.
This buying is not speculative. The trajectory of Chinese demand has a structural explanation rooted in three simultaneous forces. First, Chinese savers are exiting real estate: after a decade of property as the dominant savings vehicle, the collapse of that market has left hundreds of millions of savers seeking alternatives. Bank deposits offer returns below the pace of money supply growth — a guaranteed real loss. Gold offers a hedge against the very monetary expansion their government is conducting.
Second, China's government is facilitating this shift. Xi Jinping's administration has expanded storage capacity at the Shanghai Gold Exchange and broadened import channels. This is not passive — it is a state-sanctioned policy shift. The strategic rationale is explicit: reducing dependence on the dollar-denominated financial system and building gold reserves that cannot be frozen by foreign sanctions, as Russia's dollar reserves were in 2022.
Third, China's government is buying gold directly through its central bank — 19 consecutive months of official purchases as of mid-2026.
The short-term sellers in this market — Russia liquidating to fund military spending, Turkey managing energy import costs, India responding to government guidance — are creating temporary price pressure. But the volume of Chinese institutional demand has, to date, absorbed those sales without sustained downside. Each dip in gold is being bought.
The K-Shaped Dynamic in the United States
The US consumption data tells a story that matters for understanding where equity markets go next.
American Express reports strong spending among its premium customer base. Louis Vuitton and luxury goods companies see robust demand. Capital One's credit data shows that lower-income consumers are spending through borrowing, but aggregate spending remains elevated. Retail sales are at historical highs despite consumer confidence surveys that read as deeply negative. This K-shaped divergence — strong asset-owning class, strained wage-dependent class — has a specific implication for financial markets.
The upper-middle and wealthy segment of the US population has accumulated substantial liquidity in short-term financial instruments. Money market funds, Treasury bills, and bank deposits collectively hold trillions of dollars of this deferred purchasing power. That capital is waiting. When equity markets demonstrate clear upward momentum, the behavioral pattern is predictable: the fear of missing out converts defensive cash positions into equity flows.
This is a self-reinforcing dynamic. A rally attracts the sideline capital. That capital accelerates the rally. The rally attracts more capital. The $32 trillion M2 supply, 70% of which is household savings, represents the fuel available if this ignition occurs. It is not a guarantee — it requires a catalyst — but the magnitude of available liquidity means that when the catalyst arrives, the move can be larger and faster than most expect.
The Practical Implication
The argument is not that cash should be eliminated from every portfolio. Emergency reserves, near-term liquidity needs, and tactical dry powder all require holding cash. The argument is that holding cash as a long-term savings strategy — the default behavior of most people who do not actively invest — is not a neutral choice. It is a choice to accept a predictable, compounding real loss at the pace of monetary expansion.
The institutional investors who understand this — sovereign wealth funds, central banks, large family offices — are already responding. China's 163 tonnes in May is the most visible data point, but it reflects a global shift in how large pools of capital are positioning against the monetary system they operate within.
The individual investor who understands M2 dynamics, gold's production constraint, and the K-shaped demand structure in the United States has access to the same logical conclusion that is driving institutional behavior. The tools to act on it — gold ETFs, Bitcoin, equity stakes in businesses with pricing power — have never been more accessible. What changes with understanding is the willingness to act on the conclusion before the movement becomes obvious to everyone else.
Analysis based on José Luis Cava's market commentary from June 2026. This post is for informational and educational purposes only and does not constitute investment advice.
Explore the data
Check the latest congressional trades and active investment signals.