The Trap Is Sprung: How Algos Fooled Professional Managers — and Why July Looks Bullish
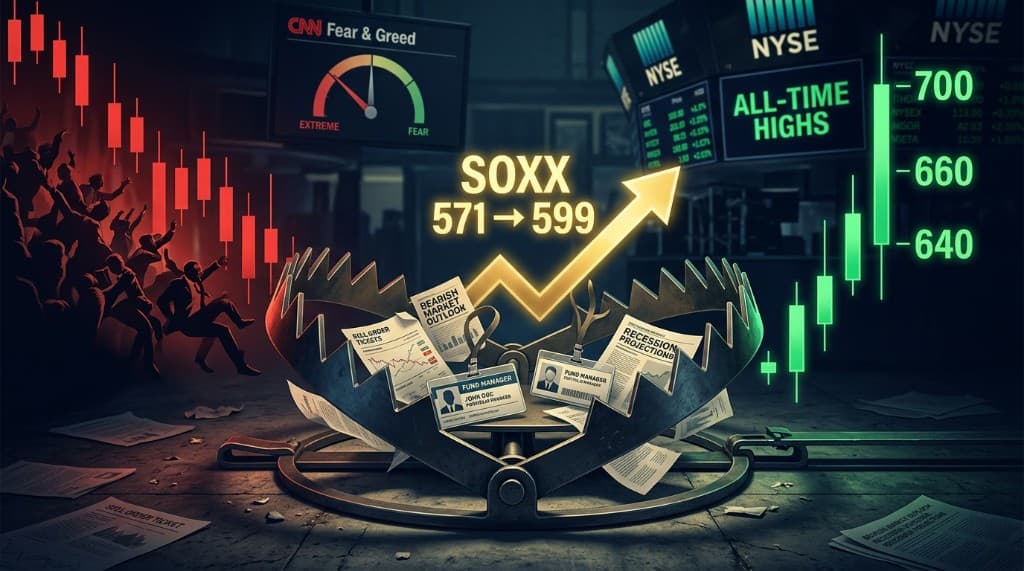
José Luis Cava documents one of the clearest algorithmic traps of 2026: professional fund managers sold US tech at the highest volume in a decade for eight consecutive days, only to be swept out at the exact bottom on June 29 as SOXX broke to 571 — then immediately bounced to 599. With extreme fear in retail sentiment, the NYSE and Dow at all-time highs, the S&P 500 advance/decline line at new peaks, and the 10-year yield turning down toward 4.31%, the setup for July is distinctly bullish.
On June 29, 2026, something happened in the semiconductor ETF that had been building for eight consecutive trading sessions. Professional fund managers — the highest-paid investors in the world, with access to the best research and the most sophisticated models — finally capitulated. They sold their remaining technology positions into the exact bottom.
Within hours, the market reversed sharply higher.
This is not a coincidence. It is a pattern that José Luis Cava calls la envolvente — the envelopment — and it plays out with remarkable consistency across asset classes and time frames.
The Anatomy of the Trap
The SOXX semiconductor ETF established two clear support levels during the June correction: a low of approximately 590.6 on June 16, and a retest low of approximately 586 on June 24. These two lows formed a visible floor that any technical analyst — human or algorithmic — could see. Positions cluster at such levels. Stop-loss orders accumulate just below them.
On June 29, a wave of algorithmic selling pushed SOXX through both support levels simultaneously, reaching 571. This was not driven by new fundamental information about semiconductor demand. It was a mechanical sweep: the price moved to where the maximum concentration of defensive orders sat, triggered those orders, and caused a cascade of forced selling.
The result was the highest volume of technology selling by North American professional fund managers in a decade — eight days of sustained liquidation culminating in a final flush at the lows.
Then, immediately after the last sellers had been removed from the market, the price reversed. SOXX bounced sharply back to 599.
This sequence — false breakdown, sweep of stops, sharp reversal — is the signature of an algorithmic envelopment. The players who were shaken out at 571 watched the instrument they just sold rally 5% within the same session. The players who understood what was happening, and held or bought the breakdown, captured that entire move.
Why 585 Is Now Critical Support
The false breakdown has a technical consequence that matters for positioning. When a price breaks a support level, sweeps the stops below it, and then re-establishes itself above that level within the same session, the support is not broken — it is reinforced. Every short position that was opened at the breakdown is now underwater. Every long position that was stopped out has been reset.
The zone around 585 in SOXX, which looked like a support that had failed, is now confirmed as a critical floor with upgraded conviction. The supply of sellers that accumulated at that level has been exhausted — they sold into the sweep, and they are now out of the market. The path of least resistance from here points toward Cava's upside targets: 640, then 660, and potentially 700.
This is not a prediction about semiconductor fundamentals. It is a statement about market structure. The mechanical pressure that drove the June correction has been released. The sellers have been extracted from the market. The technical configuration favors the buyers.
The Narrative That Was Wrong
While professional managers were selling, the dominant retail narrative was bearish — and for coherent-sounding reasons.
Inflation was supposed to be re-accelerating. Wage growth was supposed to be running too hot. The 10-year Treasury yield was headed to 5%, then 6%, with serious commentators making the case for each level. A Fed constrained by a resurgent inflation reading would be unable to cut, and perhaps forced to hike. Higher discount rates mean lower equity valuations. The logic was clean and compelling.
The data is moving in the opposite direction. Inflation expectations are falling. Wage growth in the United States is decelerating. The 10-year Treasury yield, rather than advancing toward 5% or 6%, has turned down and is now tracking toward the 4.31% area. Each of these developments removes a layer of the bearish case that was driving professional selling.
Lower yields reduce the discount rate applied to future earnings. Lower discount rates increase the present value of every future cash flow. For technology companies with long-duration earnings profiles — where a significant portion of value is concentrated in years that are far from today — even a modest decline in long-term yields produces a meaningful expansion in fair value.
The Divergence That Matters Most
The most striking feature of the current market environment is the gap between what investors feel and what markets are doing.
The CNN Fear & Greed Index is registering readings near extreme fear. Retail surveys show elevated pessimism. The dominant narrative in financial media is cautious to bearish. This is the emotional temperature of the market.
The actual data tells a different story. The NYSE Composite has marked new all-time highs. The Dow Jones Industrial Average has marked new all-time highs. The advance/decline line for the S&P 500 — which measures how many stocks are rising versus falling, regardless of market cap weighting — has reached new peaks. A full 65% of S&P 500 components are trading above their 200-session moving averages.
When breadth is expanding, when more stocks are participating in the advance, when the index that captures the entire listed market is at new highs — this is not the configuration of a market in trouble. This is a healthy bull market in which a segment of participants happens to be frightened.
The divergence between extreme fear sentiment and expanding market breadth is one of the most reliable contrarian signals in technical analysis. Extreme fear with all-time highs is not a warning. It is an invitation.
The July Setup
The synthesis of these elements — the exhaustion of professional selling, the false breakdown resolved to the upside, the narrative failures around yields and inflation, and the extreme fear reading against healthy breadth data — points in one direction for July.
Cava's reading is explicitly bullish for the month. The market has completed its sweep. The mechanical sellers are out. The narratives that were driving defensive positioning are not being validated by the data. The conditions are in place for a month of upward movement, driven in part by the enormous pool of sideline capital that has been waiting for a confirmation that the correction is over.
This does not mean markets move in a straight line. Volatility will continue. Individual sessions will produce sharp moves in both directions. But the directional bias, based on the positioning and sentiment evidence available at the end of June, favors the buyers.
The correction of August remains on the calendar — the SpaceX lock-up, the seasonal thin markets, the statistical pattern around new Federal Reserve leadership. That window, when it arrives, will represent a genuine reloading opportunity for medium-term positioning. July's rally does not eliminate August's potential dip — it sets a higher base from which that dip will occur, and potentially a more extended dip in duration rather than depth.
The Emotion Problem
Cava's broader point is worth stating plainly. Professional fund managers with decades of experience, institutional infrastructure, and high-frequency data access sold into an algorithmic trap at peak volume. Retail investors, surrounded by narratives of fear, are positioned defensively while the NYSE and Dow hit all-time highs.
The common thread is emotion — specifically, the way that pain and narrative can override the evidence available in price and breadth data. The professional selling was not driven by new information. It was driven by the discomfort of watching a position move against them for eight sessions, compounded by risk management frameworks that forced liquidation at the worst moment.
The investor who operates from a system — defined entry criteria, understanding of support structures, recognition of false breakdowns — does not need to be more intelligent than the professional fund manager. They need to be less emotional in the specific moment when emotion is most costly.
The setup described here, in which extreme fear coexists with all-time highs and expanding breadth, is precisely the environment in which systematic thinking outperforms emotional reaction. The trap has been sprung. The question is which side of it each investor finds themselves on.
Analysis based on José Luis Cava's market commentary from June 30, 2026. This post is for informational and educational purposes only and does not constitute investment advice.
Explore the data
Check the latest congressional trades and active investment signals.