PER 19, GDP at 4%, and the Two Indicators That Actually Call Market Tops
José Luis Cava makes the quantitative case against the bubble narrative: the S&P 500 forward PER of 19 for end 2026 is cheap relative to a 4.5% bond yield, hyperscalers are investing 3% of US GDP in AI infrastructure, and US growth could approach 4% by 2027. More importantly, he identifies the two technical indicators that reliably signal genuine market tops — the VIX and implied correlation — and explains why both at current lows mean we are in a rotation, not a peak. Meanwhile, China has resumed liquidity injection after a temporary withdrawal, clearing the path for gold and Bitcoin to resume their structural uptrend.
The argument that equity markets are in a bubble has been made continuously since 2020. It was made when the S&P 500 was at 4,000. It was made at 5,000. It is being made again now. Each iteration of the argument points to elevated price-to-earnings ratios as the primary evidence. And each iteration, José Luis Cava argues, misunderstands how bubbles actually end.
Why PER Alone Does Not Pop Bubbles
The S&P 500 forward PER — the ratio of the current index price to expected earnings over the next twelve months — stands at approximately 19 for end 2026. This is above the historical average of 15-16, and the bubble narrative uses this fact as its central exhibit.
The argument has a structural problem: PER multiples do not pop bubbles. Central banks pop bubbles, by withdrawing liquidity from the financial system until the cost of capital rises enough to make the expected returns on equities unattractive relative to risk-free alternatives.
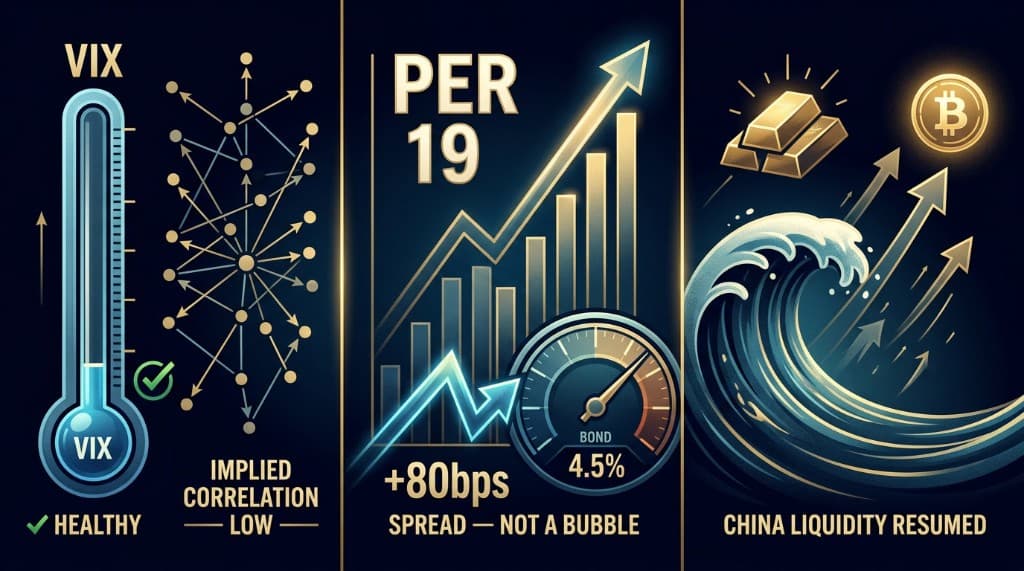
At a 4.5% 10-year Treasury yield, a PER of 19 implies an earnings yield of approximately 5.3% on equities. That is an 80 basis point spread over the risk-free rate — meaningfully positive, not the compressed or negative spread that characterizes genuine bubble conditions. In 2000, the earnings yield on the Nasdaq was below the risk-free rate. Investors were paying more for equities than for Treasuries on an earnings basis, which only makes sense if you believe earnings will grow explosively. The current spread, at 80 basis points positive, is not that situation.
The more precise way to frame the valuation is: at a 19x forward PER with a 4.5% bond yield, equities offer a reasonable return premium over risk-free assets. They are not cheap by historical standards, but they are not irrationally expensive either. The conditions that would make them genuinely dangerous — a central bank aggressively withdrawing liquidity while earnings disappoint — are not present.
The Earnings Acceleration That Changes the Multiple Calculation
The PER argument becomes even less compelling when the denominator — expected earnings — is rising. Two structural forces are accelerating US corporate earnings in a way that markets may not have fully priced.
First, hyperscalers — Microsoft, Alphabet, Amazon, and Meta — are collectively investing approximately 3% of US GDP in artificial intelligence infrastructure. This capital expenditure does not disappear. It flows through supply chains, construction companies, power utilities, cooling system manufacturers, and ultimately into the economy as wage payments, equipment purchases, and operating revenues. The multiplier effect of 3% of GDP in productive investment is substantial, and it represents demand that was not present in any previous economic cycle.
Second, the US fiscal deficit is running at 6.5% of GDP — high by historical standards, but also a significant ongoing source of demand stimulus in the economy. Whether one considers this fiscally prudent or not is a political question. The economic consequence is straightforward: it is money that enters the economy and supports consumption, investment, and corporate revenues.
The combined effect of 3% AI infrastructure investment and 6.5% fiscal deficit creates conditions in which Cava projects US GDP growth could approach 4% by 2027. If earnings grow at even half that rate in real terms — 2% — and inflation adds another 2.5-3%, nominal earnings growth of 4-5% per year would compress the forward PER mechanically as the denominator grows. A market that looks expensive at 19x today looks reasonably valued at 16x in two years if earnings deliver.
The Two Indicators That Actually Predict Market Tops
Understanding what does not predict market tops — the PER level alone — is less useful than understanding what does. Cava identifies two specific technical indicators that, when read together, provide the most reliable signal of genuine market tops.
The VIX (CBOE Volatility Index) measures the market's expectation of 30-day volatility in S&P 500 options. A rising VIX indicates that options traders are paying up for protection — that they expect large moves and are hedging accordingly. A falling or low VIX indicates that the same professional traders see limited near-term risk and are not willing to pay premiums for protection.
Implied correlation measures the degree to which individual stocks within the S&P 500 are expected to move together. High implied correlation means that when the market moves, nearly all stocks move in the same direction — the classic signature of a panic or risk-off event. Low implied correlation means that stocks are moving independently of each other, driven by their own company-specific factors rather than a common macro shock.
The critical insight is that genuine market tops — the kind that lead to extended bear markets — form when both indicators spike simultaneously. When the VIX rises sharply, it signals that volatility is being priced in across the board. When implied correlation rises at the same time, it signals that the market is moving as a single entity rather than as a collection of individual businesses. Together, a high VIX and high implied correlation mean: everything is falling together, professional traders are pricing in severe risk, and the market is behaving like a panic.
Both indicators are currently at low levels. The VIX is near its lows, indicating that options traders see limited near-term downside risk. Implied correlation is also near its lows, indicating that stocks are moving independently — some correcting, others making highs, with the aggregate driven by individual business performance rather than macro panic.
This combination — VIX low, correlation low — is precisely what characterizes healthy rotation, not market tops. It is the technical signature of a market where capital is moving between sectors (from semiconductors that rose 50% into biotech, pharma, and insurance that are now making highs) without a broad deterioration in aggregate confidence. The RSP, the equal-weight S&P 500 that gives every company identical weight, making all-time highs while the Nasdaq corrects is the index-level expression of the same dynamic.
For active investors, this configuration is the ideal environment. When sectors move independently and volatility is low, the opportunity to identify which sectors have exhausted their run (semiconductors and AI infrastructure after a 50% gain) and which are just beginning to attract capital (healthcare, insurance) is maximized. The market is rewarding analysis, not just indexing.
China Has Resumed Liquidity Injection
The recent decline in gold and Bitcoin has a specific cause that is worth understanding precisely because understanding it clarifies what comes next.
China's central bank temporarily withdrew liquidity in the past weeks. The purpose appears to have been to slow domestic economic activity and reduce oil consumption — potentially as part of an implicit agreement with the United States in the context of ongoing geopolitical negotiations. The consequence was mechanical: when the world's second-largest economy withdraws liquidity, asset prices globally that are sensitive to liquidity flows — gold, Bitcoin, emerging market equities — come under pressure.
China has now resumed injecting liquidity. The temporary withdrawal is over. This matters for two reasons.
First, it provides an explanation for the correction in gold and Bitcoin that is consistent with our existing thesis. Neither asset fell because the fundamental case changed. The global monetary expansion that makes hard assets structurally attractive continued throughout the period. The specific, temporary Chinese withdrawal caused a specific, temporary repricing. Knowing the cause clarifies that the effect is also temporary.
Second, the resumption of Chinese liquidity injection is the precondition for the next leg of the uptrend in both assets. Gold's structural support — China importing 163 tonnes per month, central banks accumulating globally, the monetary expansion differential between money supply growth and gold production — did not change. Bitcoin's structural support — fixed supply, growing institutional adoption, Basel III regulatory validation — did not change. The pause is over. The question is when the next advance begins, not whether it does.
For investors positioned in gold ETFs and Bitcoin, the message is the same as it has been: the thesis is intact, the correction was mechanical, the structural tailwinds remain. The discomfort of watching a position correct when the fundamental case has not changed is the price paid for eventually capturing the full move when the supporting conditions reassert themselves.
What to Do With the Rotation
The practical conclusion of Cava's analysis for current portfolio positioning is specific. Sectors that led the advance — semiconductors, AI infrastructure — are in a corrective phase after gains that approached 50% from the lows. This is normal and healthy; assets that rise 50% in a short period require time and lateral price action to rebuild the base for the next advance.
During this corrective period, capital is not standing still. It is rotating into sectors that have not participated in the AI-driven advance to the same degree: healthcare, biotech, pharmaceuticals, insurance. These sectors are making new highs as technology corrects, which is the definition of healthy rotation and the opposite of a market in distress.
The appropriate response is not to panic about the technology correction and not to chase the rotation into healthcare. It is to give the technology correction the time it needs to complete — which the VIX and implied correlation data suggest it will, without becoming systemic — and to have the liquidity ready to add to technology positions when the correction has run its course and the base has been rebuilt.
That moment is what the August window has been anticipating.
Analysis based on José Luis Cava's market commentary from July 6, 2026. This post is for informational and educational purposes only and does not constitute investment advice.
Explore the data
Check the latest congressional trades and active investment signals.