Why the Buffett Indicator Is Wrong at 234% — and the One Ratio That Actually Calls Market Tops
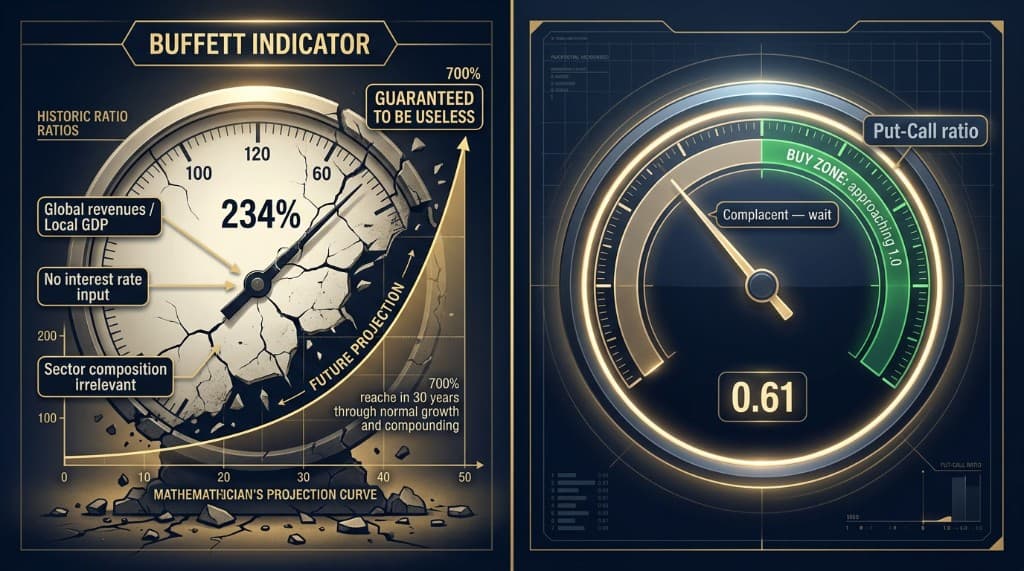
The Buffett Indicator — total US stock market value divided by US GDP — sits at an all-time high of 234%. Many analysts cite this as evidence of an imminent crash. José Luis Cava argues it is measuring the wrong things and will mathematically reach 700% to 800% in 30 years regardless of whether a bubble exists. The indicator that actually identifies genuine market extremes is the Put-Call ratio of the S&P 500. Currently at 0.60 to 0.61, it says the market is complacent but not yet at a buying opportunity. The real entry signal comes when that ratio approaches 1.0 — when fear returns and investors start buying protection again.
The Buffett Indicator is at 234%. This number appears in financial media as a warning sign, cited as evidence that US equities are more overvalued than at any point in history — more than in 2000, more than in 2021, more than at any previous market peak.
José Luis Cava's position is that this reading proves almost nothing about whether markets are in a bubble, and that continuing to use it as a primary valuation signal will cost investors money in both directions: by scaring them out of positions that continue rising and by failing to identify when actual extremes have been reached.
Two Truths About How Markets Work
Before addressing the indicator itself, Cava establishes a framework that shapes everything that follows.
The first truth is that equity markets have a structural upward bias over the medium and long term. The S&P 500 has averaged approximately 10% per year across its full history. This is not a coincidence or a reflection of exceptional economic conditions. It is the direct consequence of monetary debasement. Politicians and central banks continuously dilute the purchasing power of fiat currencies to make accumulated debts easier to service in nominal terms. Assets — businesses, real estate, commodities — rise in nominal terms because the unit of measurement is shrinking.
This is the core reason that holding cash over long periods is not "safe." Cash loses purchasing power at roughly the rate of monetary expansion. Equities, which represent ownership of productive businesses, preserve and grow purchasing power over time even as the currency depreciates. The 10% annual return is the system working as designed, not a gift from the market.
The second truth is that the system is deliberately made difficult. If generating investment returns were obviously easy, everyone would do it and the advantage would disappear. Volatility exists — and is amplified by financial media — precisely to prevent simple participation from being rewarding. The media operates on fear because fear generates attention and attention generates revenue. Every market correction comes packaged with a compelling narrative explaining why this time the decline will be permanent. Every one of those narratives has eventually been wrong.
The Buffett Indicator: What It Measures and Why It Misleads
The Buffett Indicator divides total US stock market capitalization by US gross domestic product. Warren Buffett described it as the single best measure of where valuations stand at any given moment. At 234%, it is higher than it has ever been.
Cava identifies several structural reasons why this comparison has become increasingly unreliable.
The numerator is global, the denominator is local. The companies that make up the US stock market — particularly the largest ones — generate the majority of their revenue outside the United States. Apple sells iPhones in China and Europe. Microsoft licenses Azure to enterprises on every continent. Alphabet runs advertising across the global internet. Many of these companies are incorporated or structured in ways that book profits in Ireland, the Netherlands, or other jurisdictions with favorable tax treatment. Their market capitalization reflects global earnings, but US GDP reflects only domestic economic output. Comparing a global number to a local one produces a ratio that grows simply as companies become more internationally diversified.
The composition of the market has changed fundamentally. The S&P 500 of 2026 is not the S&P 500 of 2000 or 1990. The largest companies today are software businesses, AI infrastructure providers, cloud platforms, and data enterprises. These businesses generate revenue with marginal costs near zero, can scale globally without proportional increases in physical capital, and produce profit margins that would have seemed implausible to the manufacturing and retail-heavy indices of previous decades. The Buffett Indicator does not adjust for this shift in the nature of what is being valued.
It ignores the interest rate environment entirely. A market trading at a price-to-earnings ratio of 19 when 10-year bonds yield 4.5% is in a different position than the same market at the same P/E when bonds yield 1%. The equity risk premium — the excess return investors demand for holding stocks over risk-free bonds — is the mechanism that connects valuations to interest rates. The Buffett Indicator contains no interest rate input. It cannot distinguish between a market that is genuinely stretched and one that is rationally priced given the yield environment.
The mathematical trajectory makes the indicator useless as a long-term signal. This is Cava's most pointed argument. If equity markets compound at 10% annually and nominal US GDP grows at approximately 6% — 2.7% real growth plus 3.3% inflation — the Buffett Indicator grows by 4% per year simply from the differential. Starting at 234%, this trajectory produces readings of 700% to 800% in 30 years without any bubble, without any excessive speculation, and without any fundamental deterioration. A tool that is "guaranteed" to reach extreme readings through normal market functioning cannot meaningfully identify extreme readings.
The Ratio That Actually Works
In place of the Buffett Indicator, Cava proposes monitoring the Put-Call ratio of the S&P 500 options market.
The Put-Call ratio measures the volume of put options — which are bets on declining prices or insurance against declines — relative to call options, which are bets on rising prices. A ratio above 1.0 means more puts are being bought than calls: investors are paying for protection, positioning for declines, expressing fear. A ratio below 1.0 means more calls than puts: investors are positioning for upside, not seeking protection, expressing confidence or complacency.
The current reading is 0.60 to 0.61.
This is a low ratio. It means the market is broadly comfortable. Call buying significantly exceeds put buying. Investors are not paying for insurance. They are not expressing fear.
What this does not mean is that the market is about to crash or that existing positions should be liquidated. Low fear readings can persist for extended periods in bull markets, and the Maradona dynamic described in recent analysis — where a central bank pivot removes the rate hike threat — could send the ratio lower still before it reverses.
What it does mean is that the current environment is not presenting the asymmetric buying opportunity that characterizes the ideal entry point. The best entries in any market occur when fear is present, when the Put-Call ratio is elevated, when investors are actively purchasing protection because they genuinely expect further declines. At those moments, the downside is already partially priced in and the potential upside from a recovery is largest.
The actionable signal comes when the Put-Call ratio approaches 1.0. That reading — call volume and put volume in rough balance, with fear actively present in the options market — is the confirmation that fear has returned sufficiently to create opportunity.
The Strategy This Implies
Cava's prescription for the current environment is precise: hold existing positions, tighten protective stops, and wait.
The two truths with which he began support this posture. The structural upward bias means that selling in anticipation of a correction that may or may not materialize in the near term carries a real cost — every day out of the market is a day without the 10% annual compounding. The volatility-as-control-mechanism means that the correction, when it comes, will be accompanied by media narratives designed to make it feel permanent and to deter buying at exactly the moment when buying would be most rewarding.
The Put-Call ratio is the instrument that cuts through the narrative. It is not measuring what journalists are writing or what analysts are saying. It is measuring what professional market participants are actually paying to protect themselves against. When they stop paying, it is not the time to buy. When they start paying heavily — when the ratio approaches or exceeds 1.0 — the setup that Cava has been describing for months as the entry point of the cycle begins to materialize.
The market has not yet provided that confirmation. The waiting continues.
Analysis based on José Luis Cava's market commentary from July 14, 2026. This post is for informational and educational purposes only and does not constitute investment advice.
Explore the data
Check the latest congressional trades and active investment signals.