The 0.618 Signal: Why the Semiconductor Correction Is Fuel, Not Fire
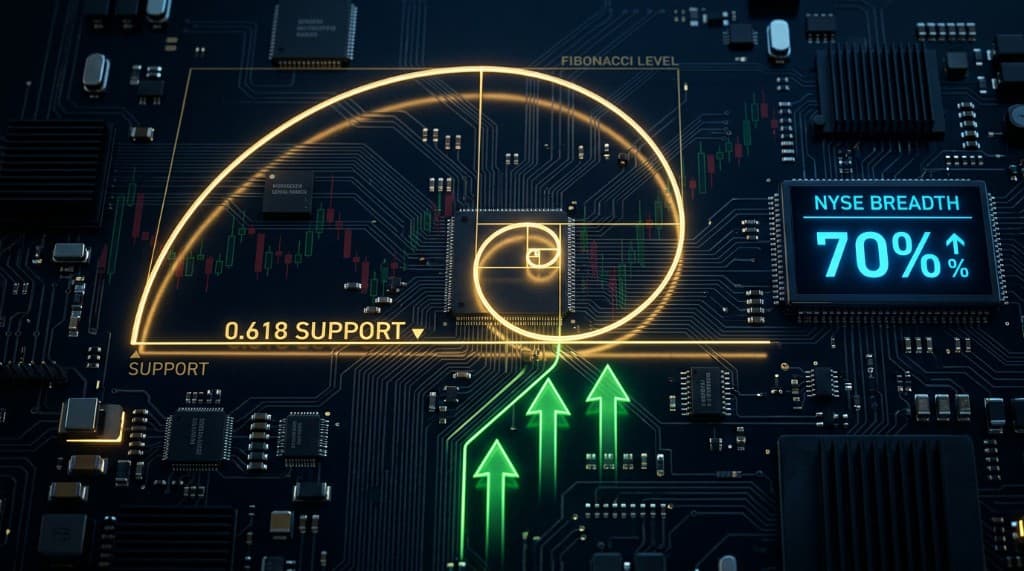
The Philadelphia Semiconductor Index has corrected sharply from its June 2026 peak, and SK Hynix has returned to the exact level where its last major rally began on May 8. José Luis Cava identifies this as a Fibonacci 0.618 support — the golden ratio — where two independent technical structures converge on the same price. Meanwhile, NYSE breadth shows 70% of stocks above their 200-day moving average, the advance-decline line sits at all-time highs, and China has pivoted from withdrawing liquidity to injecting it. The conclusion: this is not a collapse. It is a mechanical cleanup of leveraged positions before the next wave.
In technical analysis, the most powerful support levels are not round numbers. They are not psychological thresholds invented by commentators. They are the points where two independent mathematical structures — calculated from different time frames, measuring different moves — arrive at exactly the same price. When that happens, the market has two separate reasons to defend the same level.
That is precisely where SK Hynix sits today.
The Fibonacci Structure
The Fibonacci sequence — discovered by Leonardo of Pisa in the 13th century while solving a problem about rabbit reproduction — produces a ratio between consecutive numbers that stabilizes at 0.618. This number, known as the golden ratio, appears throughout nature: in the spiral of a nautilus shell, the seed arrangement of a sunflower, the branching of trees, the proportions of the human body. Markets, built from the collective decisions of millions of human beings governed by fear and greed, tend to trace the same proportions.
When an asset corrects after a significant rally, Fibonacci analysis identifies the most likely levels where buyers will re-emerge: 38.2%, 50%, and most critically, 61.8% of the prior move. A return to 61.8% of the prior advance is not a signal that the trend has ended. It is the most common resting point before the trend resumes.
José Luis Cava identifies the critical support for SK Hynix (ticker: 000660) at 1,600,000 Korean won — the price level of May 8, 2026, where the last major upward leg began. In euros, this translates to approximately 1,010 to 1,015 euros.
What makes this level exceptional is the double confluence. From the short-term perspective — the May 8 to June 22 rally — the current price represents a 100% retracement: the stock has returned to exactly where that specific impulse began. From the longer-term perspective — a structural move that started from lows near 584 euros in late 2024 — the current price corresponds to the 0.618 Fibonacci retracement of the entire advance. Two separate calculations, measured from different origins, arrive at the same destination.
This is why Cava calls it the critical level. It is not arbitrary. It is the intersection of two different memories the market has of the same asset.
What the NYSE Is Telling Us
A correction in semiconductors raises an obvious question: is this the beginning of a broader market deterioration, or a sector-specific event?
The NYSE Composite Index — which encompasses approximately 3,000 companies and reflects the breadth of the real economy, not just the technology-heavy composition of the Nasdaq — answers this question clearly. It is moving sideways, not lower. Its trend remains intact.
More revealing are the internal indicators. The advance-decline line for the NYSE is at all-time highs. This measures the daily difference between stocks advancing and stocks declining, cumulated over time. When markets are genuinely deteriorating, the advance-decline line falls before the index does — institutions reduce exposure across the board, dragging breadth lower while headline indices are still held up by their largest components.
That is not what is happening now. The breadth is healthy.
Additionally, 70% of NYSE stocks are trading above their 200-day moving average. This figure matters because the 200-day average is the standard definition of a long-term uptrend for an individual stock. When 70% of stocks in a universe of 3,000 are above that line, the structural condition of the market is bullish. Corrections at this level of breadth are almost always rotational — money moving between sectors — rather than a systemic exit from equities.
The MTUM ETF, which holds large-cap momentum stocks and was driven sharply higher by semiconductors between March and June 2026 (a period of exceptional sector concentration), is now correcting toward its own Fibonacci support near 287 — the 50% retracement of its prior advance, which coincides with the May 19 low. The same mathematical structure is appearing across multiple instruments simultaneously.
The Macro Accelerators
Two macroeconomic developments deserve attention as potential catalysts for the next leg higher.
In China, the official unemployment rate of 5% masks a reality that Cava estimates at closer to 10%, given the structural weakness in domestic demand. A government facing those numbers has limited options: it either accepts the social pressure of stagnation or deploys stimulus. The People's Bank of China has already pivoted from withdrawing liquidity — which was the dominant pressure suppressing global markets in the first half of 2026 — to injecting it. This shift is not a minor data point. For several months, the PBOC was the primary source of global liquidity contraction, overwhelming the expansionary signals from Western central banks. That headwind is now reversing.
In Iran, credible reports describe conditions of severe scarcity in food, medicine, and energy — including electricity outages during summer heat. A regime under that level of internal stress is closer to collapse than stability. The geopolitical significance of this for energy markets and global risk premiums is substantial. A reduction in Middle Eastern conflict risk removes one of the persistent upward pressures on oil prices, which in turn reduces the inflationary argument against rate cuts, and lowers the risk premium embedded in all financial assets.
Neither of these developments requires optimism about geopolitics. They are mechanical inputs to the global liquidity equation.
The Purpose of This Correction
Cava describes the function of the current correction with a specific phrase: limpieza de apalancados — the cleanup of leveraged investors.
The 115% rise in the Philadelphia Semiconductor Index between late March and late June 2026 attracted two categories of late entrants: Korean retail investors operating with borrowed capital, and institutional fund managers who had underweighted semiconductors and moved aggressively to correct their positioning near the top. Both groups entered at prices that have now proven unsustainable in the short term. The correction forces them out, resets the sentiment indicators, and transfers the shares to holders with longer time horizons and no leverage.
This is how trends reload. It is not comfortable to observe. But it is structurally different from a trend ending.
The AI infrastructure thesis — the reason semiconductors grew from 4% to 22% of the S&P 500 — has not changed. NVIDIA and AMD are generating real earnings. The robotics wave (a single humanoid robot requires 50 times more semiconductors than a smartphone) is arriving in volume in 2027. These are not speculative narratives about future revenues. They are orders on balance sheets today.
The 0.618 level is where the market decides whether the thesis survives the test. Based on NYSE breadth, advance-decline data, and the macro pivot in China, the evidence points toward survival.
The fuel is being loaded. The question is only how long the engine takes to restart.
Explore the data
Check the latest congressional trades and active investment signals.