The Trap at the Top: Four Market Peaks, One Pattern — and What the Put-Call Ratio Is Telling Us Now
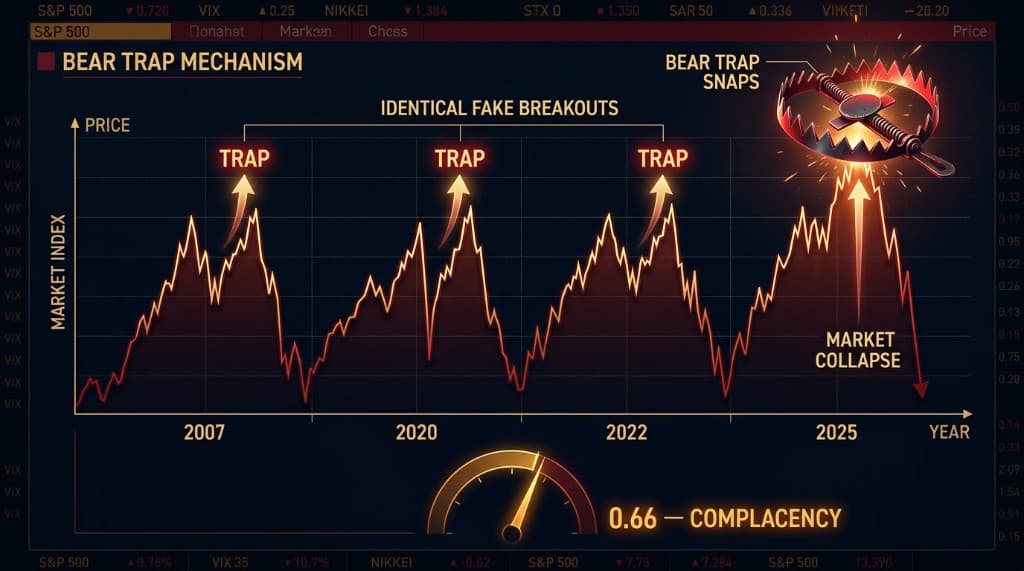
Jose Luis Cava has identified a recurring mechanical pattern at every major market top since 2007: a rally to a high, a corrective phase, and then a fake breakout to a marginally higher level that triggers buy stops and captures liquidity before a violent reversal. This pattern appeared in 2007, 2020, 2022, and 2025. The S&P 500 reached 7,620 in early June 2026 before entering a corrective phase. The put-call ratio currently sits at 0.66 — still in the complacency zone. If the index were to recover above 7,620 and then reverse sharply, that would confirm the trap. Until then, the corrective phase represents an opportunity window — not a signal to exit.
Every major market top in recent history has followed the same mechanical sequence. Not because markets are predictable, but because human psychology under conditions of greed and fear is consistent — and algorithms, built to exploit that psychology, have learned to execute the same playbook at scale.
Jose Luis Cava has documented this pattern across four distinct market peaks. Understanding it changes how you interpret both the current correction and the signal that would indicate something more serious is beginning.
The Anatomy of a Market Top
The pattern unfolds in three phases.
Phase one — the rally. The market rises to a significant high. Investors are confident. Fear is absent. This absence of fear is measurable: the put-call ratio, which tracks the relative demand for protective put options versus speculative call options, falls to low levels — typically below 0.70. When nobody is buying protection, nobody is afraid. When nobody is afraid, everyone is buying.
Phase two — the correction. After the initial high, the market enters a corrective phase. This is where most investors misread the signal. The correction looks like the beginning of a downturn. Risk-averse participants reduce exposure. Stop-loss orders accumulate just below key support levels.
Phase three — the trap. The market makes one final push higher, breaking above the level of the initial peak. This movement has a specific mechanical purpose: it triggers the buy stops placed by investors who missed the first rally and were waiting for a confirmed breakout. It captures the liquidity of those orders. And then, once that liquidity has been absorbed, the market reverses — violently.
The participants who entered on the fake breakout, convinced the bull run was resuming, become trapped. Their positions were built on the wrong premise at the worst possible moment.
Four Peaks, One Sequence
The historical record is specific.
2007. The S&P 500 reached 1,556 in July. After a corrective phase, it pushed to 1,576 in October — 20 points above the prior high. That marginal new high was the trap. What followed was the 2008 financial crisis and a 57% decline in the index.
2020. The index reached 3,338 in January. It corrected, then pushed to 3,393 in February — 55 points above the prior high. Days later, the COVID crash began. The index fell 34% in 33 days, the fastest bear market in history.
2022. The market closed 2021 at 4,743. After a corrective start to the new year, it pushed to 4,818 in January — 75 points above the prior closing high. That was the trap. The subsequent bear market erased 27% of the index's value over the following twelve months.
2025. The index reached 6,000 in December 2024. After a corrective phase, it pushed to 6,147 in February 2025 — 147 points above the prior high. That was the moment Donald Trump's tariff announcements triggered a cascade that took the index down sharply over the following weeks.
The pattern is not perfectly identical in magnitude or timing. What is consistent is the structure: a first high, a corrective pause, and then a marginally higher high that acts as a liquidity extraction mechanism before the real move begins.
Where We Are Now
The S&P 500 established a high of 7,620 in early June 2026. Since then, the index has entered a corrective phase.
As of the date of this analysis, two indicators define the current situation.
The put-call ratio stands at 0.66. This number is meaningful. A ratio below 0.70 indicates that investors are not buying protection — they remain confident that the correction is temporary and that the rally will resume. This is the condition of the market in phase two of the pattern: corrective, but not fearful. Historical bottoms that mark genuine entry opportunities tend to occur when the put-call ratio approaches 1.0 — when fear becomes widespread enough that investors are paying substantial premiums for downside protection.
At 0.66, the ratio has not reached that level. There is still complacency in the market. This does not mean the correction will necessarily deepen further. But it does mean that the conditions for a durable market bottom — widespread fear, capitulation selling, maximum pessimism — have not yet been met.
The critical signal to watch: if the S&P 500 recovers to break above 7,620 and then reverses sharply, that would be the confirmation of the trap pattern. It would indicate that the corrective phase was not a buying opportunity but rather phase two of the same sequence observed in 2007, 2020, 2022, and 2025.
Until that signal appears, the corrective phase is an opportunity window — the time between the first high and the potential trap — during which fundamentally strong assets can be accumulated at prices below where they were trading at the peak.
The Tax-Efficient Hedge
For investors who hold significant long positions — index ETFs or individual positions with large unrealized gains — selling during a correction creates a taxable event. In many European jurisdictions, transferring from equity funds to money market instruments can take two to three days to execute. In a violent correction, that delay can be costly.
Cava proposes an alternative: rather than selling long positions, purchase a leveraged inverse ETF to offset the downside exposure. A 3x inverse instrument on the S&P 500 requires approximately one-third of the portfolio value to provide full coverage. If the portfolio is worth 100,000 euros, a position of 30,000 euros in a 3x inverse ETF provides a hedge without triggering a sale of the underlying positions.
The instruments identified for this purpose are SPXS for US market participants and 3USS for European investors operating under UCITS regulation — the latter trades in dollars on the London Stock Exchange with a 0.8% expense ratio and is structured as an accumulation vehicle.
These instruments carry significant risks. The 3x leverage amplifies losses as readily as gains, and the volatility decay effect means they lose value over time in sideways or slowly trending markets. They are tactical instruments, designed for short periods during which a clear directional view is held — not long-term holdings.
The Distinction That Matters
The pattern Cava describes is not a prediction that the market will top at 7,620. It is a framework for recognizing, in real time, when the conditions for a trap are being established.
The corrective phase we are currently in resembles the phase two of prior tops. But phase two also describes the normal mid-cycle corrections that occur within ongoing bull markets — the pullbacks that test conviction before the advance resumes. The difference between a mid-cycle correction and the setup for a trap only becomes clear in phase three.
The put-call ratio is the clearest measure of where the market sits on that spectrum. At 0.66, it signals that the current correction has not generated the fear required for a genuine bottom. That may mean the correction has further to go. Or it may mean the market bottoms at current levels and the 0.66 reading proves to be the new normal for this cycle.
What the reading does not support is the conclusion that maximum fear has been reached and that the risk of further decline has been fully priced in.
Patience, capital discipline, and a clear understanding of what a phase three signal looks like — these are the tools that make the difference between being the one who sets the trap and being the one caught in it.
Explore the data
Check the latest congressional trades and active investment signals.