Michael Burry Is Short — But the Three Conditions for a Market Top Are Not Met
Michael Burry has opened massive short positions on the Nasdaq 100, semiconductors, Palantir, and NVIDIA. But according to José Luis Cava, three conditions must be present before a genuine market top forms — and none of them are currently in place. The real lesson from Burry's 2008 trade is not that he was right, but that he was right two years too early, which for any normal speculator means account liquidation. Plus: how algorithms use fake breakouts to trap both bulls and bears before the real move, and what early Bitcoin signals actually mean.
The most famous short in history — and its hidden lesson
Michael Burry, the investor made famous by The Big Short, has opened significant put positions against the Nasdaq 100 through QQQ options, the semiconductor index, Palantir, and NVIDIA. The financial media is treating this as a signal that the technology rally is ending.
Cava's response is precise: Burry may be right about the direction. He is almost certainly wrong about the timing. And in markets, being right about the direction while wrong about the timing is functionally identical to being simply wrong.
The evidence is in Burry's own track record. He identified the subprime mortgage crisis and began positioning for it in 2005 and 2006. He was correct. But from the moment he opened those short positions, the S&P 500 continued rising for another 30%. Any normal speculator — operating with standard margin and position sizing — would have been margin-called and forced out of the market before seeing a single dollar of profit. Burry survived only because his fund structure gave him unusual protection against early losses. His investors famously tried to redeem and he refused to let them. That is not a replicable model for retail investors.
The lesson from Burry is not to follow his conviction. It is to understand that even correct macro analysis, applied too early, destroys capital.
The three conditions for a genuine market top
For a speculator operating within Cava's framework, no market top is tradeable until three conditions are simultaneously present:
Condition one: Euphoria. The emotional environment must reflect extreme optimism — the kind that pulls uninformed capital into markets at scale. Currently: the Nasdaq 100 has risen more than 50% from its March lows. Yet the percentage of bullish investors has increased by only approximately 3 percentage points. Short interest remains elevated. The majority of retail investors missed the rally entirely, sitting in money market funds. This is the opposite of euphoria. It is widespread skepticism in the face of a rising market.
Condition two: Monetary policy alignment. A genuine top requires that the primary source of liquidity — the central bank — begins withdrawing support from the system. Currently: the Federal Reserve maintains an expansive stance, purchasing approximately $8-9 billion weekly in Treasury bills. Other central banks (Japan, Europe, England, China) are restrictive or withdrawing. This creates a corrective environment — not a reversal of the underlying trend.
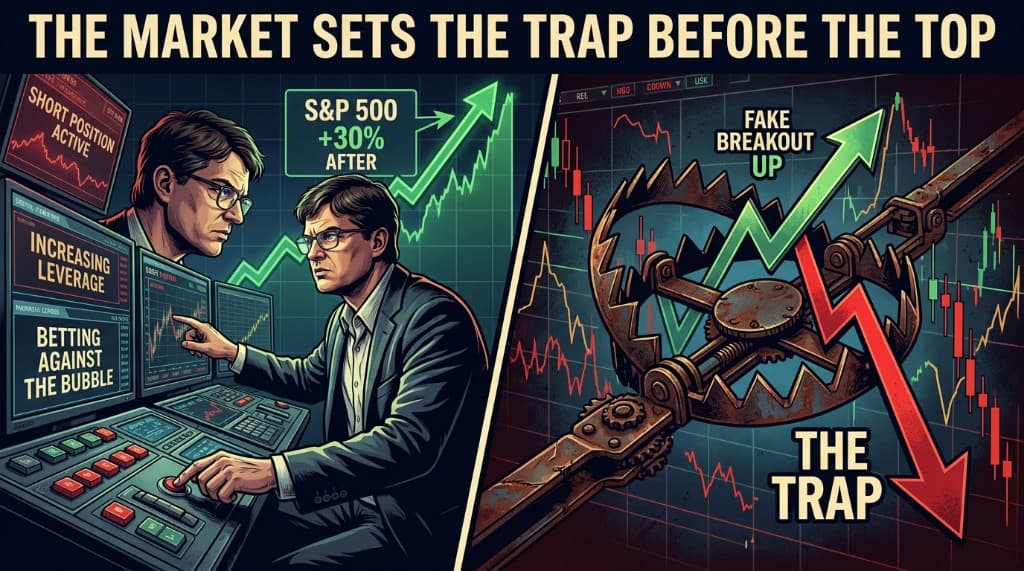
Condition three: The Trap. Markets do not form genuine tops without first executing a move designed to sweep the maximum number of participants to the wrong side. This is not a metaphor — it is an observable technical pattern, and it has not yet occurred in the current cycle.
How the trap works: 2007 and 2009
The mechanism of the trap is best understood through two historical examples that Cava cites directly.
October 2007 — the top trap: The S&P 500 had been consolidating below its year-2000 all-time highs for years. In October 2007, it broke above those highs, triggering the buy-stops of every investor who had been waiting for a confirmed breakout. Those investors bought at the highs — and the market immediately reversed and began the most severe bear market since the Great Depression. The false breakout was the trap: it provided the exit liquidity for institutional sellers.
March 2009 — the bottom trap: The S&P 500 had been declining toward the 2002 lows. When it broke below those lows, it triggered the stop-losses of the last remaining long-term holders who had survived the entire bear market. After forcing those final sellers to capitulate, the market reversed and began an uninterrupted advance that would last a decade. The false breakdown was the trap: it provided the entry liquidity for institutional buyers.
In both cases, the extreme move in one direction preceded the real move in the opposite direction. The trap is how the algorithms transfer positions from weak hands to strong hands — or from strong hands to weak hands — at the optimal price.
The current situation (2026): The April and May candlesticks on the Nasdaq are exceptionally strong — wide-bodied, high-volume advances that do not resemble the topping patterns of 2000 or 2007. No trap structure is visible. Burry's positions may be correct in identifying the eventual direction. But the trap that must precede the top has not been set.
Early Bitcoin signals: bounce forming, but not a confirmed bottom
Cava identifies several technical signals in the cryptocurrency ecosystem that suggest a short-term floor is forming — with important caveats.
MicroStrategy (MSTR): An identifiable institutional buyer acquired 51,700 call options with an August expiration at a $127.50 strike price. This is a significant directional bet — the kind that requires either privileged information or high conviction based on technical analysis. The MSTR chart shows that previous swing lows have already been swept (the standard precondition for a reversal). The probable target for this move is a gap fill in the $140-150 zone. Building a solid base will require additional time.
WGMI (Bitcoin miners ETF): While Bitcoin itself was declining, the WGMI mining ETF showed an upward movement — a divergence from its normal correlation with Bitcoin. This divergence, which typically appears during lateral consolidation phases, is technically significant. The ETF has swept the buyers below the 60 zone, printed a strong volume session with a long lower wick, and is showing the technical profile of a short-term bottom. The expected target is the 72 zone, which would sweep the current bearish positioning.
WLF: A component representing approximately 9% of WGMI. This name completed a stop sweep at approximately $23.95 and has reversed upward, with a target of approximately $27-28.
Cava's preference: for speculative exposure to the crypto recovery, the mining ETF (WGMI) offers a stronger relative trend and cleaner risk management than direct Bitcoin exposure. WGMI's leverage to Bitcoin price moves, combined with the current divergence, creates a more favorable asymmetry.
Bitcoin itself: A possible inverted head-and-shoulders pattern is forming — a structure that, if completed, would signal exhaustion of the downward move. However, this pattern requires more time and price action to confirm. The current expectation is a technical bounce driven by these preliminary formations, not a confirmed major bottom. Patience before any significant position increase.
The operative conclusion
Burry may be right. The market will eventually top. But the three conditions that must precede a genuine, tradeable top are not present: no euphoria, no aligned monetary policy withdrawal, no trap structure visible on the charts.
The corrective phase of May-June 2026 is a rotation within a bullish trend, not its end. The capital that holds its nerve through this correction, and is deployed at the levels where the technical signals confirm a floor, will be positioned for the continuation that follows.
The trap has not been set. The top has not been made.
Analysis based on a José Luis Cava video published June 9, 2026. For informational purposes only — not financial advice.
Explore the data
Check the latest congressional trades and active investment signals.