Three Contrarian Signals: Dollar at Resistance, Bonds Ready to Bounce, Oil Sweep Completed
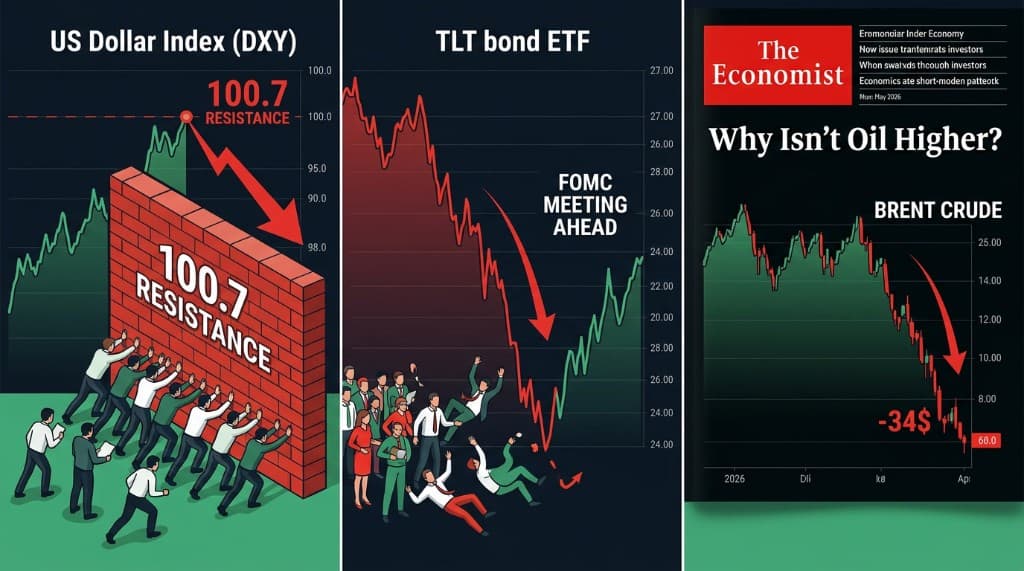
José Luis Cava applies contrarian analysis to three markets simultaneously. Oil has completed its sweep below the March lows — the market is now clean and positioned for a recovery toward $84 if $79.7 holds. The dollar (DXY) faces formidable resistance at 100.7 with overcrowded long positions — a setup that historically precedes sharp declines. And the TLT bond ETF has swept out all investors who entered since September 2025, setting up a price bounce that implies falling yields ahead of the upcoming FOMC meeting. All three signals, read together, point toward an improving liquidity environment for risk assets.
The contrarian framework
Cava describes himself as a fan of contrary opinion theory — the practice of identifying moments when market participants have moved overwhelmingly to one side of a trade, creating the conditions for a sharp reversal. The theory does not predict what will happen. It identifies when the crowd has become so consensus-driven that the setup favors the opposite direction. Today's analysis applies this framework to three markets at once.
Oil: the sweep is complete
The Brent crude price has done exactly what contrarian analysis would predict in an oversold setup: it swept below the March 10, 2026 lows, triggering the stop losses of all buyers who entered during the previous cycle. This price action serves a mechanical purpose — it forces weak hands out of the market, reducing selling pressure and leaving the remaining holder base more committed. The market is, in Cava's phrase, "clean."
The immediate technical trigger to watch is $79.7. If Brent recovers above this level sharply — closing above it rather than briefly touching it — the setup calls for a move toward the $84 zone. The underlying dynamics that drove the setup remain: US strategic reserves are near historic lows, Cushing inventories are at operational stress levels, and the supply from Iran and Qatar that the market has priced in faces real logistical constraints. Iranian oil requires functioning pipeline infrastructure that has not operated at scale for years. The Hormuz Strait ships are still navigating at night with GPS disabled — a fact the market knows but has perhaps not fully priced into the timing of actual supply normalization.
The additional variable this Friday: the Iranian Ministry of Foreign Affairs has indicated that details of the memorandum will be released publicly. The expected content includes the formal end of hostilities, Hormuz normalization protocol, and partial release of blocked funds for reconstruction. The lack of transparency in the negotiating text creates the conditions for violent price swings in both directions as interpretations differ. Cava's broader point: a memorandum is not a treaty, and 60 days of subsequent nuclear negotiations will keep volatility elevated through the summer.
The dollar at maximum overcrowding
The dollar index (DXY) faces a technical configuration that Cava reads as a high-probability contrarian sell. DXY has approached the 100.7 level, which represents significant resistance from prior price cycles. More importantly, the positioning structure is deeply crowded: the majority of market participants currently hold long dollar positions, anticipating continued dollar strength driven by US rate differentials and safe-haven demand.
When positioning becomes this one-sided, the setup favors the minority. The crowd is already in the trade. There are fewer buyers remaining to push the price higher, while the accumulated long position represents a large amount of potential selling pressure waiting to be released. A failure at 100.7 — especially against the backdrop of a potentially dovish FOMC — would create the conditions for a sharp dollar decline as those long positions are unwound.
For investors in global assets, a dollar decline has broad positive consequences. It improves the relative performance of non-dollar assets, reduces the discount rate pressure on growth equity valuations, and typically coincides with improved liquidity conditions in emerging markets and commodities.
TLT: the bond sweep and falling yields
The TLT — the ETF tracking long-dated US Treasury bonds — has undergone a textbook sweep pattern. Every investor who entered a long position in TLT from September 2025 onward has been stopped out. The price action went below the level where all those entries were concentrated, triggering their protective stops, and has now left the market clean of those positions.
This setup, combined with the upcoming FOMC meeting, creates the conditions for a significant bounce in TLT prices — which is equivalent to a fall in long-term bond yields. The mechanism is the same as the oil sweep: forced selling has temporarily pushed prices below fair value, removing the overhang of weak hands. When that selling pressure exhausts itself, the remaining buyers — who are more committed and better positioned — reassert control.
Falling yields, if this scenario plays out, would have immediate positive consequences for growth equity valuations: lower discount rates make future earnings more valuable in present terms, supporting higher multiples for technology and AI-infrastructure companies. The combination of dollar weakness and falling yields would represent a significant improvement in the macro liquidity environment.
The Economist as a contrarian barometer
Cava uses a specific historical example to illustrate the power of contrary opinion: the May 2026 cover of The Economist asked, in effect, why oil prices were not higher given the geopolitical environment, at a moment when Brent was trading at approximately $112 per barrel. That cover marked the precise top of the oil market before a $34 decline.
The Economist cover indicator is a well-documented phenomenon in financial markets: when mainstream consensus is strong enough to generate a cover story in a prestige publication, the trade is already fully owned by the market and therefore near exhaustion. The crowd has spoken, and the crowd is usually late.
The application to current markets: when a given narrative — dollar strength, higher oil prices, bond bear market — becomes dominant enough to feel obvious, that is precisely the moment when contrary opinion analysis begins looking for the reversal.
The poker analogy
Cava closes with an analogy that captures the discipline required for speculation: markets and poker share the requirement for a defined strategy that maximizes the probability of a favorable risk-reward outcome. The key difference is structural. In poker, you are forced to post a blind bet simply to observe the cards being dealt. In financial markets, there is no cost to watching. You can observe the setup, wait for the entry that meets your criteria, and only commit capital when the probability structure favors you.
The implication: not every setup requires action. The value of analysis is not in generating constant trades but in identifying the rare moments when the risk-reward ratio is genuinely favorable — and waiting patiently through the noise in between.
Analysis based on José Luis Cava video published June 17, 2026. For informational purposes only — not financial advice.
Explore the data
Check the latest congressional trades and active investment signals.