Korea's Black Monday: China Is Draining Liquidity and the Yuan Is the Signal to Watch
The KOSPI opened down 8% on Monday, triggering a 20-minute trading halt. The proximate cause was mechanical — catching up to the 14% Friday decline in the US-listed KWY ETF. But the root cause is structural: China's central bank is withdrawing liquidity, the Yuan is strengthening, and the ripple effects are hitting semiconductors, crypto, and gold simultaneously. José Luis Cava maps the correction targets for SK Hynix and the KOSPI, identifies 800,000+ open put contracts as a contrarian signal, and gives one technical indicator that will confirm the floor.
The anatomy of a Black Monday
The KOSPI — South Korea's benchmark equity index — opened Monday June 8 with a decline exceeding 8%, triggering an automatic trading halt of 20 minutes imposed by the exchange's circuit breakers. The immediate reaction was alarm. The actual explanation is more mechanical.
The KOSPI's US-listed proxy, the KWY ETF, had already fallen more than 14% on Friday's New York session. Monday's Korean open was not a reaction to new information — it was the domestic market catching up to a price that the international ETF had already established. The dramatic percentage move was real, but it was priced in for anyone watching the right instruments.
The deeper question is what caused the KWY to fall 14% on Friday in the first place.
The parabolic rise that made the fall inevitable
Context is essential. Between late March and early June 2026, the KOSPI moved from approximately 5,000 to 9,000 points — a gain of 80% in approximately ten weeks. During this period, retail investor participation reached extreme levels. Some Korean retail investors were reportedly cancelling insurance policies to free up capital for leveraged tech ETFs.
Cava's framework is direct: when a market moves parabolically and generates extreme complacency among retail buyers, a correction is not a risk — it is a mechanical inevitability. The function of the correction is to expel the late buyers who entered during the euphoric phase, reset the sentiment indicators, and create the conditions for the next genuine advance.
The technical targets for this "cleaning" phase:
KOSPI: The index broke the 7,841 support level. The objective is the 7,060 zone — the origin of the last impulsive wave upward. Forcing the index to that level expels everyone who bought during the final advance.
Samsung: Has broken the 320 support and is trading in the 280-263 range. Cava expects a probable further push below 263 to complete the institutional cleaning of long positions.
SK Hynix: In a downtrend following the break of the 1,980 level. The objective is the 1,700 zone — the May lows — a level that would introduce sufficient fear into the market before the structural floor forms.
The real driver: China withdrawing liquidity
The geopolitical noise around the Israel-Iran conflict is present, but Cava assigns it limited explanatory power for these moves. The primary driver is macroeconomic: a contraction of global liquidity originating from China's central bank.
The evidence is in the currency markets. The Yuan has been appreciating against the dollar. When China's central bank withdraws liquidity from the financial system, Yuan supply contracts, its exchange rate strengthens, and the capital that was flowing into risk assets globally — equities, crypto, gold — reverses.
The central bank picture globally:
- ECB: Restrictive
- Bank of Japan: Restrictive
- Federal Reserve: Expansive — purchasing approximately $8-9 billion per week in Treasury bills
- People's Bank of China: Contracting — the source of the current pressure
The Fed's purchases are providing a floor, but China's withdrawal is sufficient to create the corrective pressure visible across asset classes simultaneously. This is why the semiconductor selloff, the crypto decline toward 50,000€, and the gold pullback are happening at the same time — they share a common cause.
The indicator that will confirm the floor
Cava provides a specific, observable indicator for when this corrective phase ends:
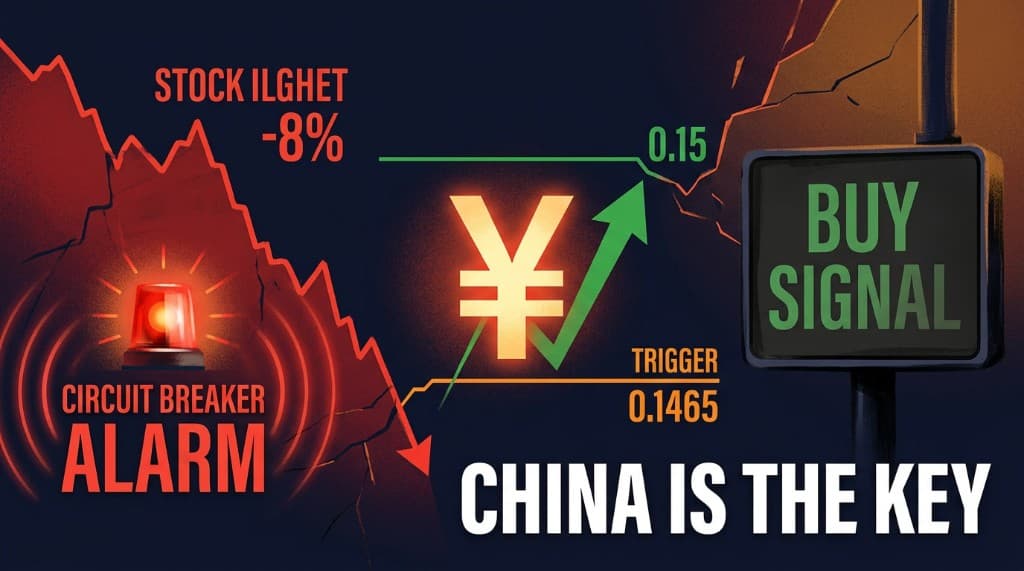
Watch the Yuan/dollar exchange rate. When it reaches the resistance level at 0.15 and then reverses to fall back below 0.1465, that is the signal that China has stopped withdrawing liquidity. When that reversal occurs, equities, cryptocurrencies, and gold will have formed their floor and the next advance begins.
This is not a prediction — it is a reaction framework. The correction ends when the cause ends. The Yuan is the fingerprint of the cause.
The contrarian signal hidden in the options market
One data point stands out as a counterintuitive bullish indicator. The KWY ETF — the US-listed KOSPI proxy — currently has more than 800,000 open put contracts. Cava describes this as a "stratospheric" level of bearish positioning.
The mechanics of extreme put positioning are well-established: when this many investors have paid for downside protection, the selling pressure that would have driven prices lower has largely been converted into options premium. The market makers who sold those puts are now managing delta exposure in a way that creates natural support. Historically, extreme put/call ratios of this magnitude have preceded sharp reversals rather than continued declines.
The 800,000 put contracts do not eliminate the remaining downside Cava identifies. But they establish the context: this correction is creating a fear level that is building the foundation of the next advance, not signaling a structural bear market.
The Fibonacci framework
The current move fits a standard Fibonacci retracement pattern. Following the parabolic advance from KOSPI 5,000 to 9,000, the 50% retracement level brings the index to approximately 7,000. This zone coincides with the origin of the last impulse wave — the level where institutional positioning was established before the final advance.
Fibonacci 50% retracements within uptrends are not breakdown signals. They are the deepest level of correction that remains compatible with the underlying bullish structure. A recovery from this zone, with appropriate volume confirmation, establishes the floor for the next advance.
Strategy: wait, then react
Cava's operational approach to this correction is defined: do not try to catch the exact bottom, and do not act until the market demonstrates it has formed one.
The specific level to monitor on KWY is 167. If the ETF reaches that level and shows a reversal — a failure to break lower with increasing volume, or a strong rejection candle — that is the entry signal to position for the recovery.
The stops are non-negotiable. If the 167 level breaks and continues lower, the thesis has been falsified and the position is exited immediately. The discipline of the stop is what allows the asymmetric trade to work: defined risk on one side, open upside on the other.
The floor is near. The signal has not yet appeared. Patience now, action when the Yuan and the KWY confirm the reversal.
Analysis based on a José Luis Cava video published June 8, 2026. For informational purposes only — not financial advice.
Explore the data
Check the latest congressional trades and active investment signals.