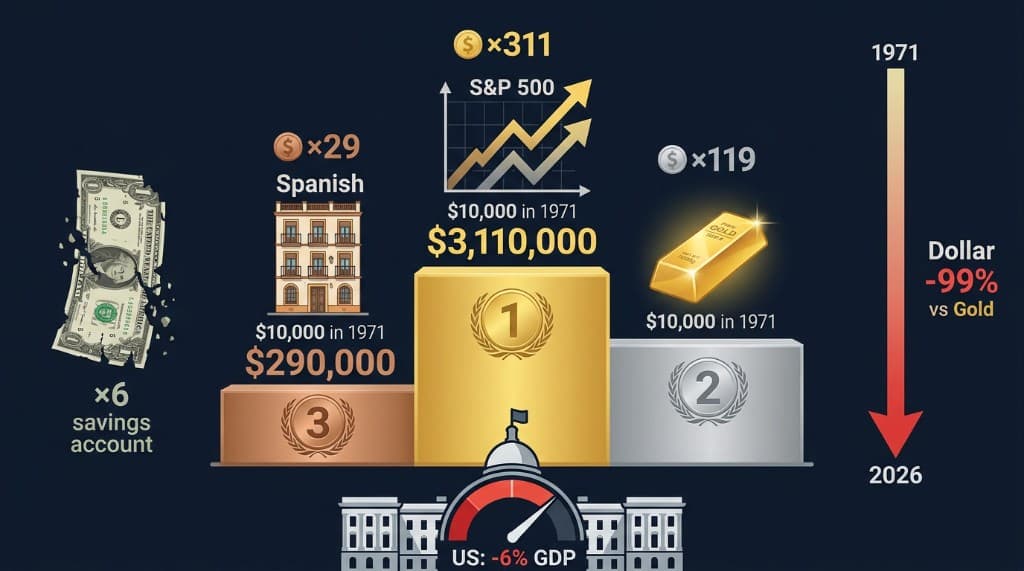
Since 1971: SP500 ×311, Gold ×119, Real Estate ×29, Savings Account ×6
Since 1971, the dollar has lost 99% of its purchasing power against gold. A savings account at 4-5% annual return multiplied your money by 6 times. Real estate multiplied by 29. Gold by 119. The SP500 with dividends reinvested: 311 times. José Luis Cava runs the numbers on five decades of monetary degradation — and explains why the only rational response is to own assets, not cash.
The starting point: 1971
The year 1971 is the hinge on which modern monetary history turns. It is the year Richard Nixon ended the convertibility of the US dollar to gold — the moment when the last constraint on money creation was removed and governments became free to finance their spending by printing without limit.
Everything that has happened in financial markets since then flows from that decision. Every bubble, every inflation cycle, every currency crisis, every wealth inequality surge has its roots in the structural change that occurred in 1971.
Cava uses this date as the baseline for a comparison that makes the case for asset ownership more clearly than any theoretical argument.
The fiscal reality in 2026
Before examining the historical data, the context: the governments driving this monetary degradation are not improving their fiscal position. They are accelerating it.
- United States: Public deficit of 6% of GDP, projected to reach 7.5% by 2028
- France, Spain, Italy: Deficits running at approximately 5% of GDP
Since 1971, politicians across the developed world have financed these deficits primarily by expanding the money supply. The result, measured in hard terms: the US dollar has lost 99% of its purchasing power against gold. The Swiss franc — historically one of the most disciplined currencies in the world — has lost 96%.
This is not a rounding error. It is a near-total erasure of the value of cash held over a generation.
The five assets, ranked
Cava runs the comparison across five asset classes, all starting from a $10,000 investment (or equivalent) in 1971:
🥉 Bronze medal — Real estate A property in Spain worth approximately 100,000 pesetas in 1971 (roughly €16,000 in current terms) is worth approximately €450,000 today — a 29× multiple over 55 years.
Real estate is a genuine store of value and outperforms cash by a wide margin. But it underperforms both gold and equities significantly, and carries costs that the comparison numbers do not fully capture: property taxes, maintenance, insurance, and in Spain, imputed income tax — you pay tax on the theoretical rental value of a property even if you never rent it out.
🥈 Silver medal — Gold $10,000 invested in gold in 1971 is worth approximately $1,190,000 today — a 119× multiple.
Gold's performance reflects exactly what it is designed to do: maintain purchasing power against monetary debasement. It is not a growth asset — it is a monetary hedge. Over 55 years it has outperformed real estate by a factor of four, primarily because it carries no property taxes, no maintenance costs, and no imputed income liability. The only costs are custody (safe deposit boxes or allocated storage).
🥇 Gold medal — SP500 with dividends reinvested $10,000 in the SP500 in 1971, with all dividends reinvested, has grown to approximately $3,110,000 — a 311× multiple.
This is the most important number in long-term investment. It is nearly three times the return of gold, nearly eleven times the return of real estate, and more than fifty times the return of a savings account. The SP500 does not just protect against monetary degradation — it compounds far above it, because the companies in the index are productive enterprises that grow earnings over time.
The tax treatment is also favorable: you only pay capital gains tax when you sell. The compounding runs for decades without a tax drag, unlike dividends from rental property or interest income from bonds.
The loser — Savings account At an average annual return of 4-5%, $10,000 in a savings account since 1971 would have grown to approximately $60,000-80,000 — roughly a 6× multiple.
Against nominal inflation alone this is inadequate. Against the actual purchasing power loss documented in the monetary data, it is a slow-motion wealth destruction. The money grows in nominal terms and shrinks in real terms.
The sectors to focus on now
Within the equity universe, Cava identifies the sectors with the strongest current momentum — the areas where "strong hands" are positioned and where the combination of AI adoption and structural demand creates the most compelling multi-year case:
- Technology — the infrastructure of the AI buildout
- Cybersecurity — mandatory spending that scales with AI adoption
- Optics — the physical transmission layer of data at AI scale
- Memory — HBM chips for AI accelerators (the SK Hynix thesis)
The tactical approach: use weekly charts to identify market floors — the kind of sweep levels that appeared in April 2025 and March 2026 — and deploy capital during the sharp corrections that these floors produce.
The system does not teach this on purpose
Cava closes with a point that goes beyond market analysis. The tools for protecting purchasing power — equity investment, understanding monetary policy, reading asset price cycles — are not taught in school. The average Spanish worker earns between €23,000 and €27,000 annually, pays into a public pension system that is structurally challenged, and depends on a public health system that is deteriorating.
Meanwhile, the population's attention is directed toward political corruption scandals and partisan polarization — real issues, but ones that do not change the underlying monetary reality. The pyramid-shaped transfer of wealth from workers to asset owners continues regardless of which party is in power, because the mechanism is monetary, not political.
The only individual response that works is to stop holding cash and start owning assets. Not because it is fair. Because the data from 1971 to today makes the alternative impossible to defend.
Analysis based on a José Luis Cava video published June 1, 2026. For informational purposes only — not financial advice.
Explore the data
Check the latest congressional trades and active investment signals.