SpaceX IPO: The European Investor's ETF Guide and the Lockup Risk Nobody Expected
The SpaceX IPO is not just an equity event — it is a macroeconomic catalyst that could accelerate US GDP growth while simultaneously creating a sharp correction risk. This HOPLA Finance analysis (recorded May 28) maps the ETF vehicles available to European investors, explains why XOVR is off-limits due to UCITS rules, and identifies JEDI (VanEck) as the most accessible option. Plus: the lockup structure that changes everything, and why entering now during a parabolic rally is the wrong move.
A macroeconomic event disguised as a stock listing
The SpaceX IPO — with a valuation around $1.7 trillion — is significantly larger than most investors appreciate. Its impact extends beyond the Nasdaq 100 inclusion mechanics covered in previous analyses. The liquidity generated for existing shareholders has the potential to accelerate US GDP growth directly through private consumption.
The numbers: the Federal Reserve of New York estimates Q2 GDP growth at approximately 2.61%. The Atlanta Fed model puts the same figure at 4.3%. Both projections reflect an already solid US economy. The wealth effect from SpaceX shareholders converting paper gains into real spending — employees, early investors, venture funds — could push this figure higher. A $75 billion equity offering creates real cash in real hands that gets spent in the real economy.
This is one of the reasons the macro backdrop for the IPO is so favorable: Musk is not listing into a weakening economy. He is listing into one that may accelerate as a direct result of the listing itself.
The lockup structure: what we know
One of the most discussed aspects of the SpaceX IPO is the departure from the standard 180-day lockup period that restricts founders, executives, and early investors from selling after an IPO.
SpaceX has eliminated the traditional lockup entirely. Some existing shareholders will have the ability to sell from day one — June 12 — creating immediate sell pressure at a level unusual for a major IPO. Given SpaceX's weighting upon Nasdaq 100 inclusion, sustained selling pressure from insiders could push the price down and drag the indices alongside it, forcing fund managers to hedge with put options and futures.
Note: More recent Cava analysis (June 4) adds nuance here — a staged lockup structure may apply to certain shareholder categories, with a first 20% selling window opening after Q2 results in late July or August. The two analyses are not necessarily contradictory: some shareholders may have no lockup, while others are subject to a staged schedule. The August risk identified in the June 4 analysis remains valid regardless.
The ETF landscape for European investors
Retail investors in Europe who want exposure to SpaceX face significant structural barriers. Here is the full breakdown:
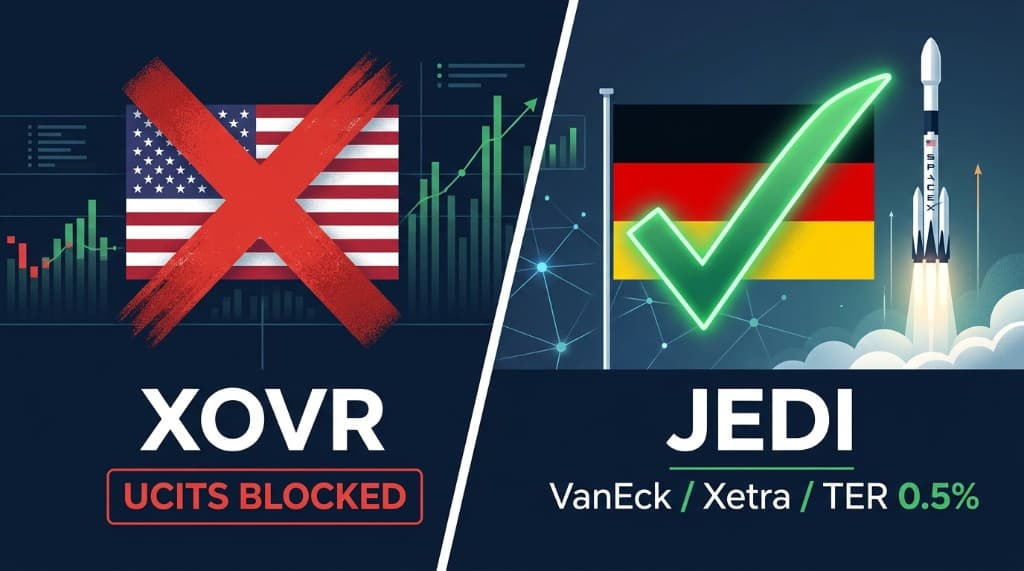
XOVR (US-listed ETF): Holds between 20% and 23% of its portfolio in SpaceX, making it the most concentrated vehicle available. However, it is completely inaccessible to European retail investors under UCITS regulation, which requires assets to be freely tradeable and caps single-security concentration at 5-10%. XOVR fails both tests. Cross this one off immediately.
ARKX (Cathie Wood, active management): The ARK Space Exploration ETF holds a diversified portfolio of space-related companies. Active management, TER of 0.75%. The problem: its performance significantly underperforms the passive alternatives despite the higher cost. Active management in a niche sector with concentrated winners has historically been a poor bet against simple index exposure.
UFO (passive): Tracks the S-Network Space Index, passive management, TER of 0.75%. Performance nearly doubles ARKX on an equivalent timeframe. Same cost, meaningfully better result. The passive approach wins here as it does in most markets.
JEDI (VanEck, European-listed): The recommended vehicle for European investors. Listed on the Deutsche Börse Xetra in euros. Passive management tracking an index comparable to UFO. TER of 0.5% — lower than both ARKX and UFO. Trades in euros, accessible through European brokers, UCITS-compliant.
For investors in Europe who want structured exposure to the space sector — including SpaceX post-IPO as it gets incorporated into relevant indices — JEDI is the most direct, lowest-cost, and most accessible option available.
Entry timing: patience over urgency
Space sector assets are currently in a parabolic rise. The SpaceX IPO narrative has driven significant price appreciation in everything from direct SpaceX vehicles to the broader ETF universe. JEDI, ARKX, UFO — all have moved substantially in anticipation of the June 12 date.
The technical recommendation is clear: do not enter during a parabolic move on the daily chart. The risk-reward at current prices does not favor new positions. The correct approach is to wait for a correction — the same correction that the IPO mechanics themselves may create — before establishing exposure.
Two conditions need to be monitored for entry:
Macroeconomic: 10-year Treasury yields must remain below 5%. Above that level, the risk-free alternative becomes attractive enough to compete with equity risk premiums, particularly in growth sectors with elevated valuations. Currently yields remain below this threshold, but the gap between "paper oil" (financial futures) and "physical oil" (spot market) has not yet fully closed. When it does, inflation expectations — currently anchored at approximately 2.54% partly due to falling oil — gain more durability, which supports the current yield level.
Technical: A visible correction in the daily chart of JEDI or comparable instruments, ideally pulling back to a zone where institutional accumulation has previously occurred. The parabolic phase must complete before the next accumulation phase begins.
The integrated SpaceX timeline
Combining both analyses, the full roadmap for investors:
June 12: IPO. Some shareholders begin selling immediately. Initial euphoria in markets. Late June: Nasdaq 100 forced inclusion. Passive funds sell semiconductors to buy SpaceX. First correction phase in index. Early July: Indices show lateral-to-downward movement. Rotation becomes visible. Late July — August: Q2 results potentially published during summer low-volume period. If staged lockup opens 20% selling window here, amplified downside in thin markets.
This extended timeline provides multiple entry windows for prepared investors. The June correction is the first signal. The August correction — if Q2 results trigger it — may be the deeper and more interesting one.
Analysis based on a HOPLA Finance video recorded approximately May 28, 2026. For informational purposes only — not financial advice.
Explore the data
Check the latest congressional trades and active investment signals.